Daly City Home Prices: Comparing Westlake and Serramonte
September 24, 2026
September 24, 2026
Search "Daly City home prices" and you'll land on a single number, somewhere around $1.13 million as of mid-2026. Search again on a different site and you'll get a different answer to a more specific question: which Daly City neighborhood is the most expensive. One data provider's August 2026 neighborhood rankings put Serramonte at the top of the list, with a median price of $1,373,280, while Sterling Park sits at the bottom at $812,434, a spread of more than half a million dollars within the same city limits. Other public estimates describe Serramonte's condo-heavy pockets closing well under $700,000 in the same period, with the city's Westlake tract of single-family homes trading closer to $1.3 million.
Both can be true at once, and that's the point. Daly City doesn't have one housing market. It has at least four, stitched together under one city name, and the citywide median is just the average of markets that don't behave alike.
The gap between these two pictures of Serramonte isn't a data error. It's a composition problem. Serramonte spans hillside single-family homes with bay views and a dense strip of condominiums near the mall, and depending on which properties closed escrow in the window a given dataset measured, the "Serramonte median" can describe either market. A month with a handful of hillside house sales will pull the number toward $1.3 million. A month dominated by condo turnover pulls it toward $700,000.
This is the trap in treating any single neighborhood median as a fixed fact. A median is a snapshot of whatever happened to sell in a specific stretch of weeks, and in a neighborhood with mixed housing stock, that snapshot can look completely different from one reporting period to the next. If you're comparing Daly City to another Peninsula city using a headline number, you're not just comparing places. You're comparing whichever slice of inventory happened to trade recently.
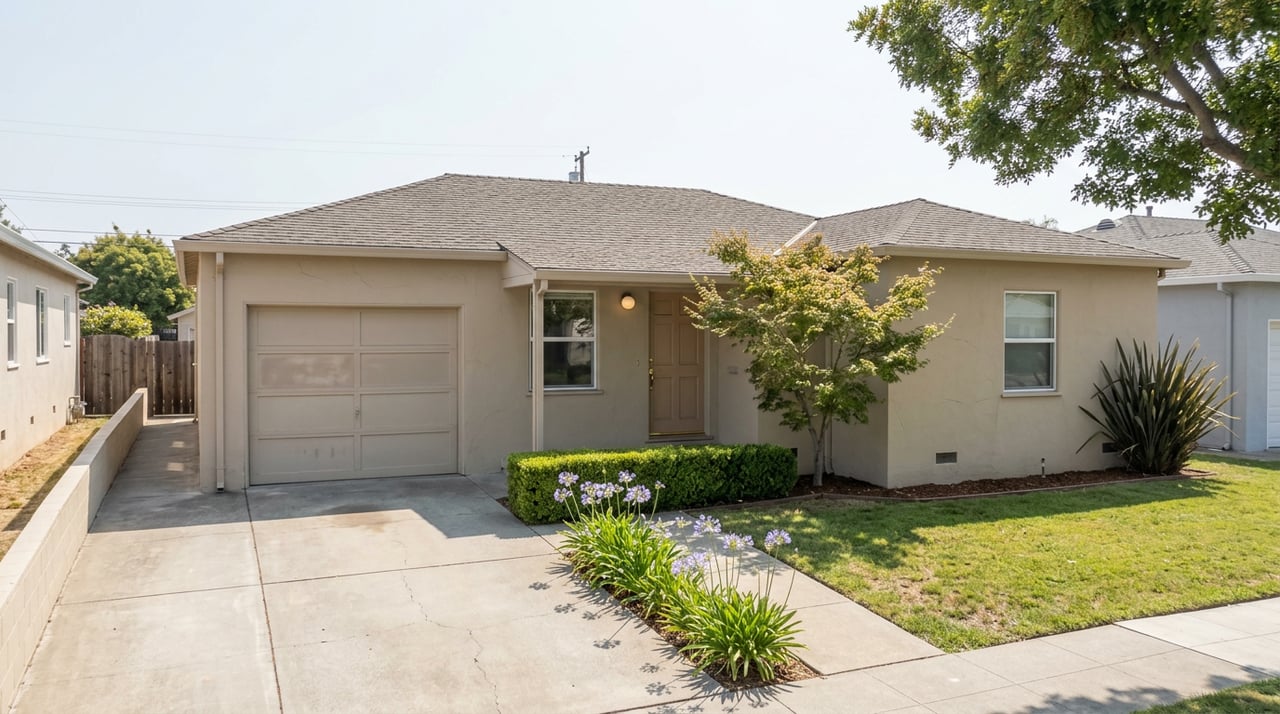
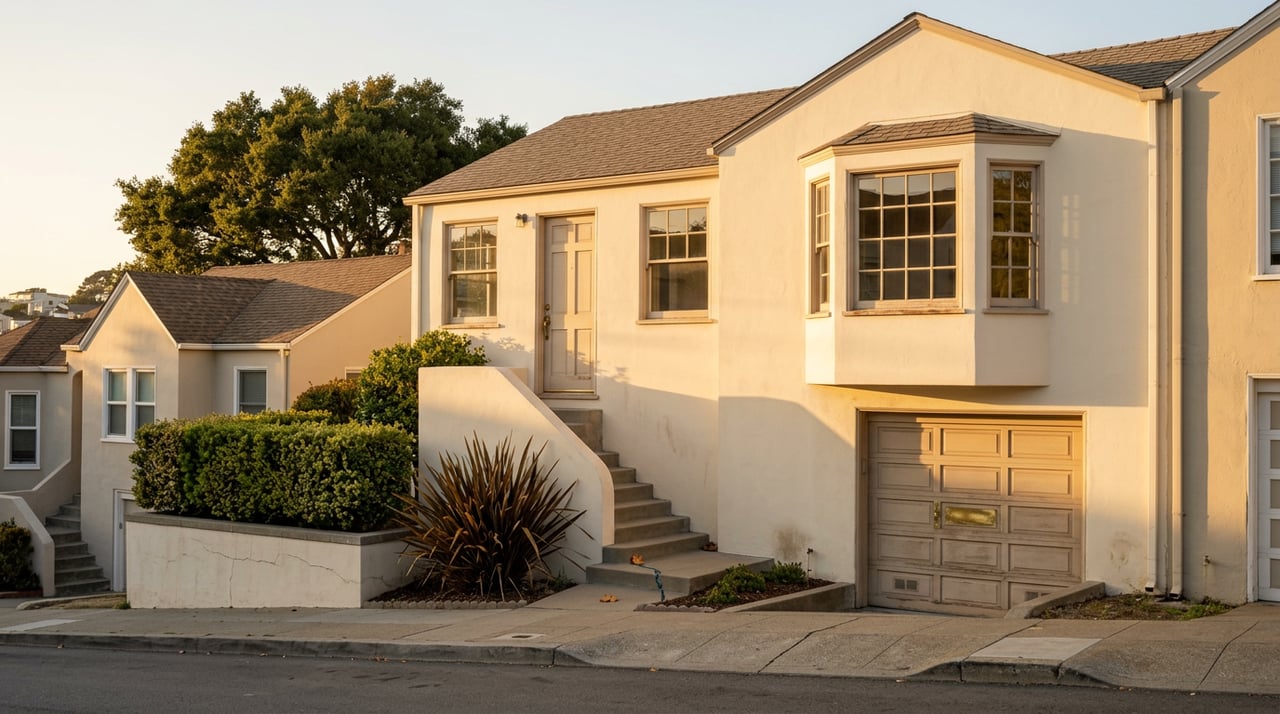
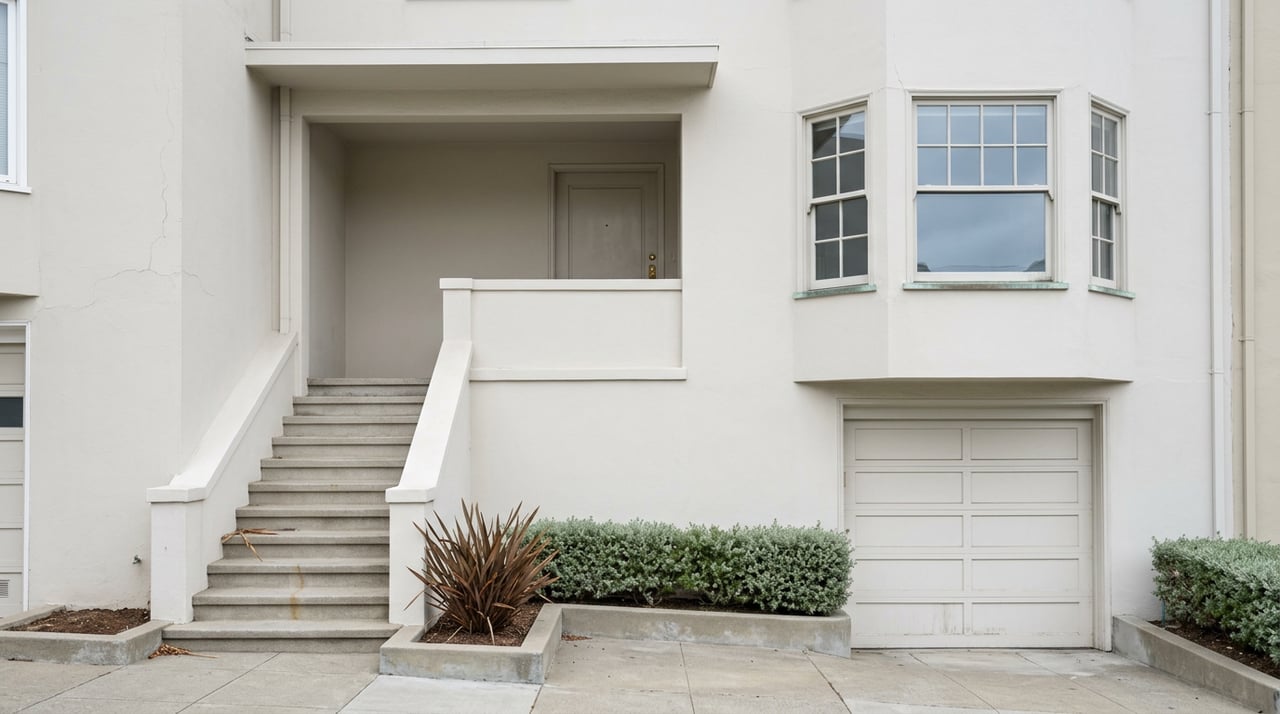
Westlake is the exception that makes the pattern visible. Unlike Serramonte's mixed stock, Westlake is close to uniform: single-family homes built by one developer, Henry Doelger, in a single building campaign after World War II. Doelger built roughly 11,000 homes across San Francisco and San Mateo counties in the late 1940s and early 1950s, and Westlake was his signature project, a planned community of small-lot houses on parcels reported by KQED at around 2,500 to 3,300 square feet, well below the lot sizes typical elsewhere on the Peninsula.
That development is also the reason Daly City shows up in unrelated searches about a 1962 folk song. Malvina Reynolds is widely credited with writing "Little Boxes" after driving past these hillside tracts, and the song became shorthand for postwar suburban conformity. Rob Keil, who wrote a book on the Westlake development and later produced a documentary about Doelger, has pushed back on the "ticky-tacky" reputation the song gave the neighborhood. As he told the San Francisco Examiner, describing a typical Doelger home:
"It was a box, but it was a really well-designed box."
The homes were built from redwood rather than the cheap materials the song implies, and Doelger reportedly varied facades and colors across each block. Whatever you think of the architecture, the uniformity is real, and it's why Westlake's pricing tends to hold together from month to month in a way Serramonte's doesn't. When almost every closed sale is a similar single-family home on a similar lot, the median actually describes the market instead of blending two of them.
Here's the August 2026 neighborhood breakdown from the same dataset, including nearby Broadmoor, alongside the citywide median for context:
| Neighborhood | Median home price (Aug. 2026) | Housing character |
|---|---|---|
| Sterling Park | $812,434 | Lowest in the city |
| Crocker | $1,008,030 | Midcentury tract homes, San Bruno Mountain views |
| Southern Hills | $1,094,350 | Hillside, bay and hill views |
| Broadmoor (outside Daly City) | $1,314,600 | Unincorporated pocket bordering the city |
| Bayshore | $1,326,350 | Near Daly City BART, mix of houses and townhouses |
| Serramonte | $1,373,280 | Highest in the ranking, but mixed condo and single-family stock |
Read across that table and the spread is the story: $560,846 separates the top and bottom of this comparison, which includes Daly City and nearby Broadmoor, an unincorporated pocket bordering the city. Serramonte's position at the top of this particular ranking is a reminder to ask what's inside a median before trusting it, not proof that every Serramonte listing commands a premium.
Two more factors explain why buyers pay differently for streets that sit close together on a map.
The Daly City BART station, which the agency itself calls the "Gateway to the Peninsula," puts riders at Embarcadero in about 18 minutes. Neighborhoods within an easy walk or short bus ride of that station, parts of Bayshore and Top of the Hill among them, carry a commute advantage that neighborhoods further from the line don't. That proximity shows up in buyer demand even when it doesn't show up as a line item in any listing.
Daly City also sits under the same marine layer that shapes weather across the Peninsula, and the boundary between fog and sun can move block by block rather than neighborhood by neighborhood. A house two streets from the coast can sit in fog while a house a half mile inland gets afternoon sun on the same day. Buyers who care about that difference are effectively shopping at a finer resolution than "neighborhood," which is one more reason a single median can't carry the weight people put on it.
If you're cross-shopping Daly City against Pacifica, South San Francisco, or the Outer Sunset, the citywide median is the least useful number available to you. A more useful question is which of Daly City's sub-markets your budget and preferences actually put you in, and whether the closed sales behind that sub-market's median were mostly houses or mostly condos.
A Westlake-style single-family home is going to comp against Outer Sunset and Pacifica houses. A Serramonte condo is going to comp against condos in South San Francisco and the outer reaches of San Francisco itself. Treating "Daly City" as one comparison point flattens two very different decisions into one number, and that's exactly the kind of mistake a neighborhood-level read can catch before you write an offer.
Why do two sources disagree about which Daly City neighborhood is most expensive? Because a neighborhood median only reflects whichever homes closed escrow during the period being measured. In a neighborhood with a mix of condos and single-family homes, like Serramonte, a month with more house sales pulls the number up, and a month with more condo turnover pulls it down. Westlake avoids this problem because its housing stock is unusually uniform.
Is Daly City actually cheaper than San Francisco? It depends entirely on which Daly City neighborhood and which San Francisco comparison you're using. A Serramonte condo and a Westlake single-family home are not competing in the same price band, and neither is directly comparable to a single citywide San Francisco figure.
Does BART proximity actually change home prices in Daly City? Distance to the Daly City BART station is one of several factors buyers weigh alongside housing type and lot size, and it tends to matter most to commuters prioritizing a fast ride into San Francisco.
If you're trying to figure out which Daly City sub-market actually fits your budget and your commute, that's a conversation best had street by street, not headline by headline. Michael Soon has spent years tracking how these Peninsula neighborhoods actually trade, not just what the citywide average says they're worth. Schedule a free neighborhood consultation to get a read on the block, not just the city.
Stay up to date on the latest real estate trends.
Understanding his client's goals has helped Michael negotiate successful outcomes buyers and sellers on all types of properties throughout the San Francisco region. Real estate, whether buying or selling, can be quite a journey, and Michael will be there every step of the way.